


"We must understand the correlation between our policies and our well being. It’s critical to move top line economic metrics, but the end goal is a thriving population. "
- Ben Goldhirsh, Matter Neuroscience co-founder
________________________________________________________________________________________________
For roughly two centuries, the systems that organize economic life have measured what can be counted: output, wages, jobs, and growth. What they have rarely asked is a more fundamental question: How are people actually doing?
A growing economy does not necessarily produce a flourishing population. National wealth has continued to rise in many countries, while many measures of well-being have not. Today, the World Health Organization estimates that more than one billion people live with a mental health condition. In the United States, Gallup found that fewer than half of adults were classified as “thriving” in early 2025, down from nearly six in ten in June 2021. And in June 2026, Tulane University’s State of the Nation Project found that across more than three decades of state data, no state is improving on life satisfaction.
Part of the problem may be what we choose to measure. A wage can be counted and a harvest weighed, but until recently, a moment of genuine human connection could only be described. What goes unmeasured tends to go unvalued. And what goes unvalued is rarely built into the systems and policies that shape our lives.
That is beginning to change. Advances in brain imaging are helping researchers better understand the biology of positive emotion. The emerging science suggests that many of the experiences associated with well-being are social: connecting with others, taking pride in meaningful work, feeling safe, and contributing to the lives of the people around us.
The Well-Being Line brings that science to a nationwide survey. It looks at which everyday experiences, from shared meals to meaningful work, are most closely connected to a satisfying life, and how much well-being varies from district to district.
In our nationwide survey, one in five registered American voters rates their current life a 4 or lower on a scale of 0 to 10, placing them below what this report calls the well-being line.*
But the study also points toward what separates people with higher life satisfaction from those with lower life satisfaction. People who regularly share meals with someone they love, have someone to call in a crisis, know their neighbors, and feel energized by their work report substantially higher life satisfaction. Those gaps are considerably larger than the differences observed between political parties, races, or genders.
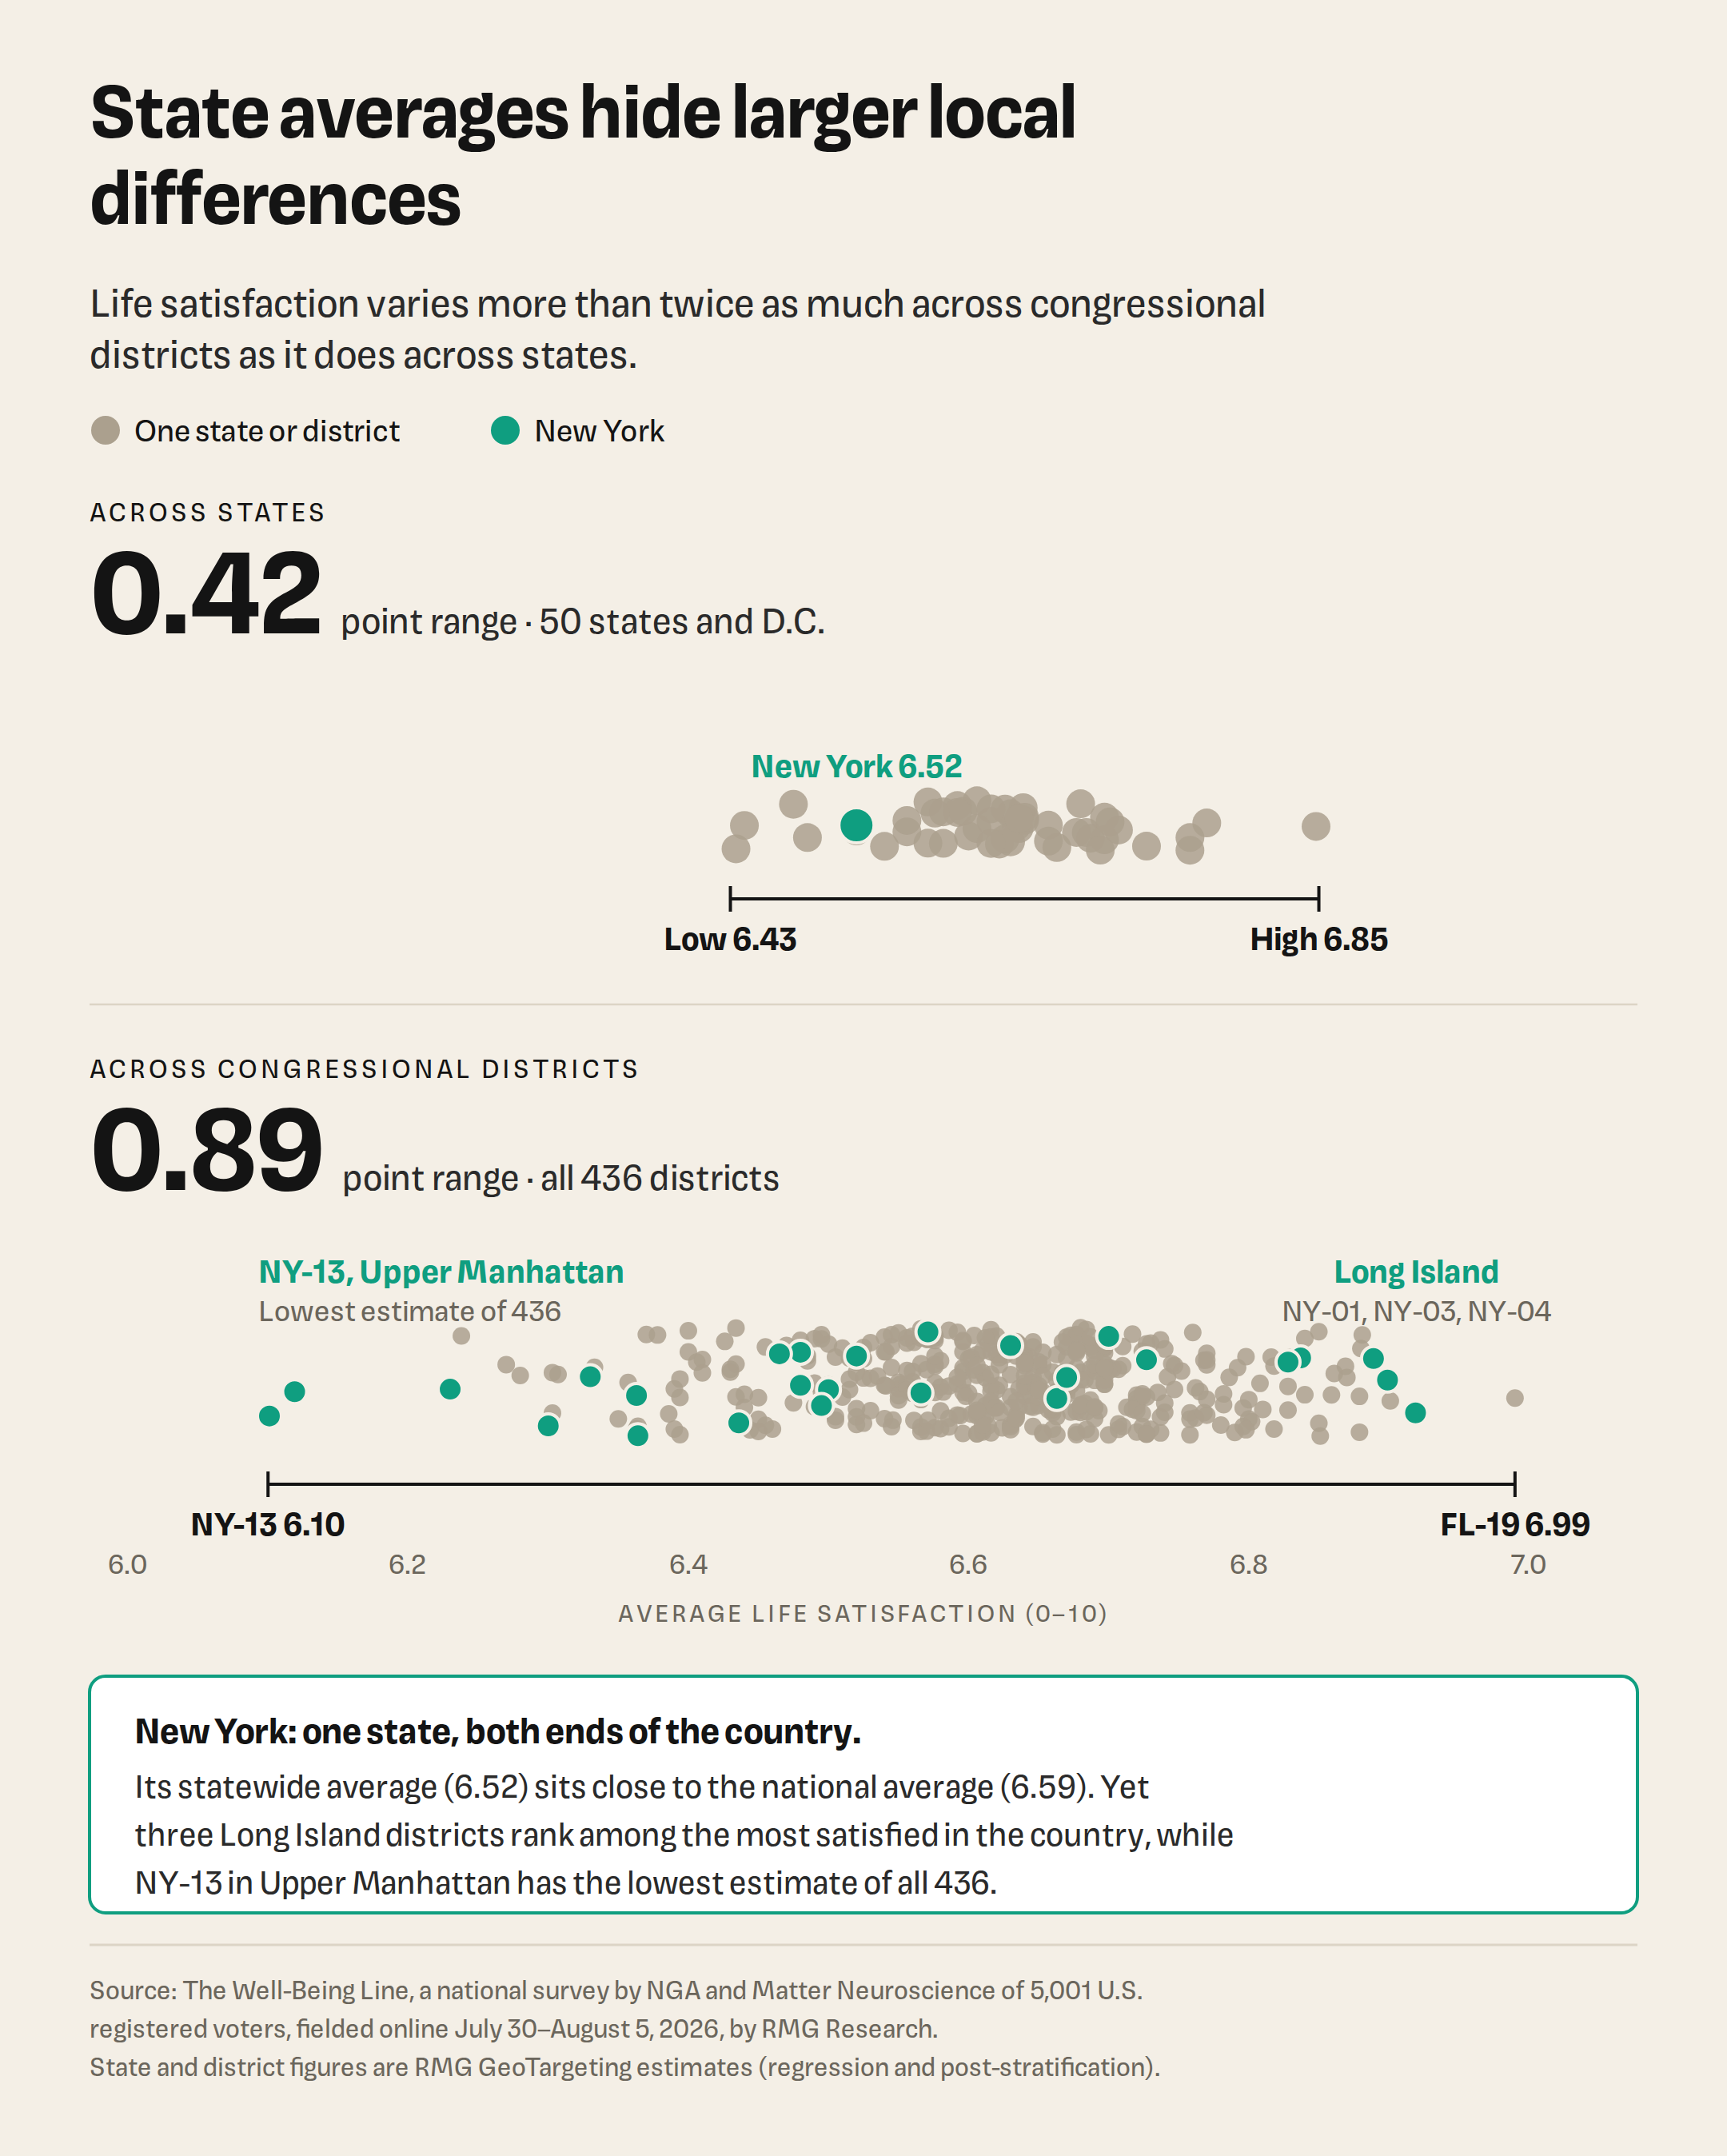
Where people live matters too, although not always in the ways statewide rankings suggest. New York’s average is close to the national average, yet the state contains communities at both the top and bottom of the country.
The findings point toward a different way of understanding happiness. It is not simply a personal mindset or a statewide condition. It is closely associated with the relationships, opportunities, safety, and support people experience in everyday life.
Across nearly every dimension measured, the same pattern appears: meaningful work, gratitude, health, connection, and safety become more common as life satisfaction rises.
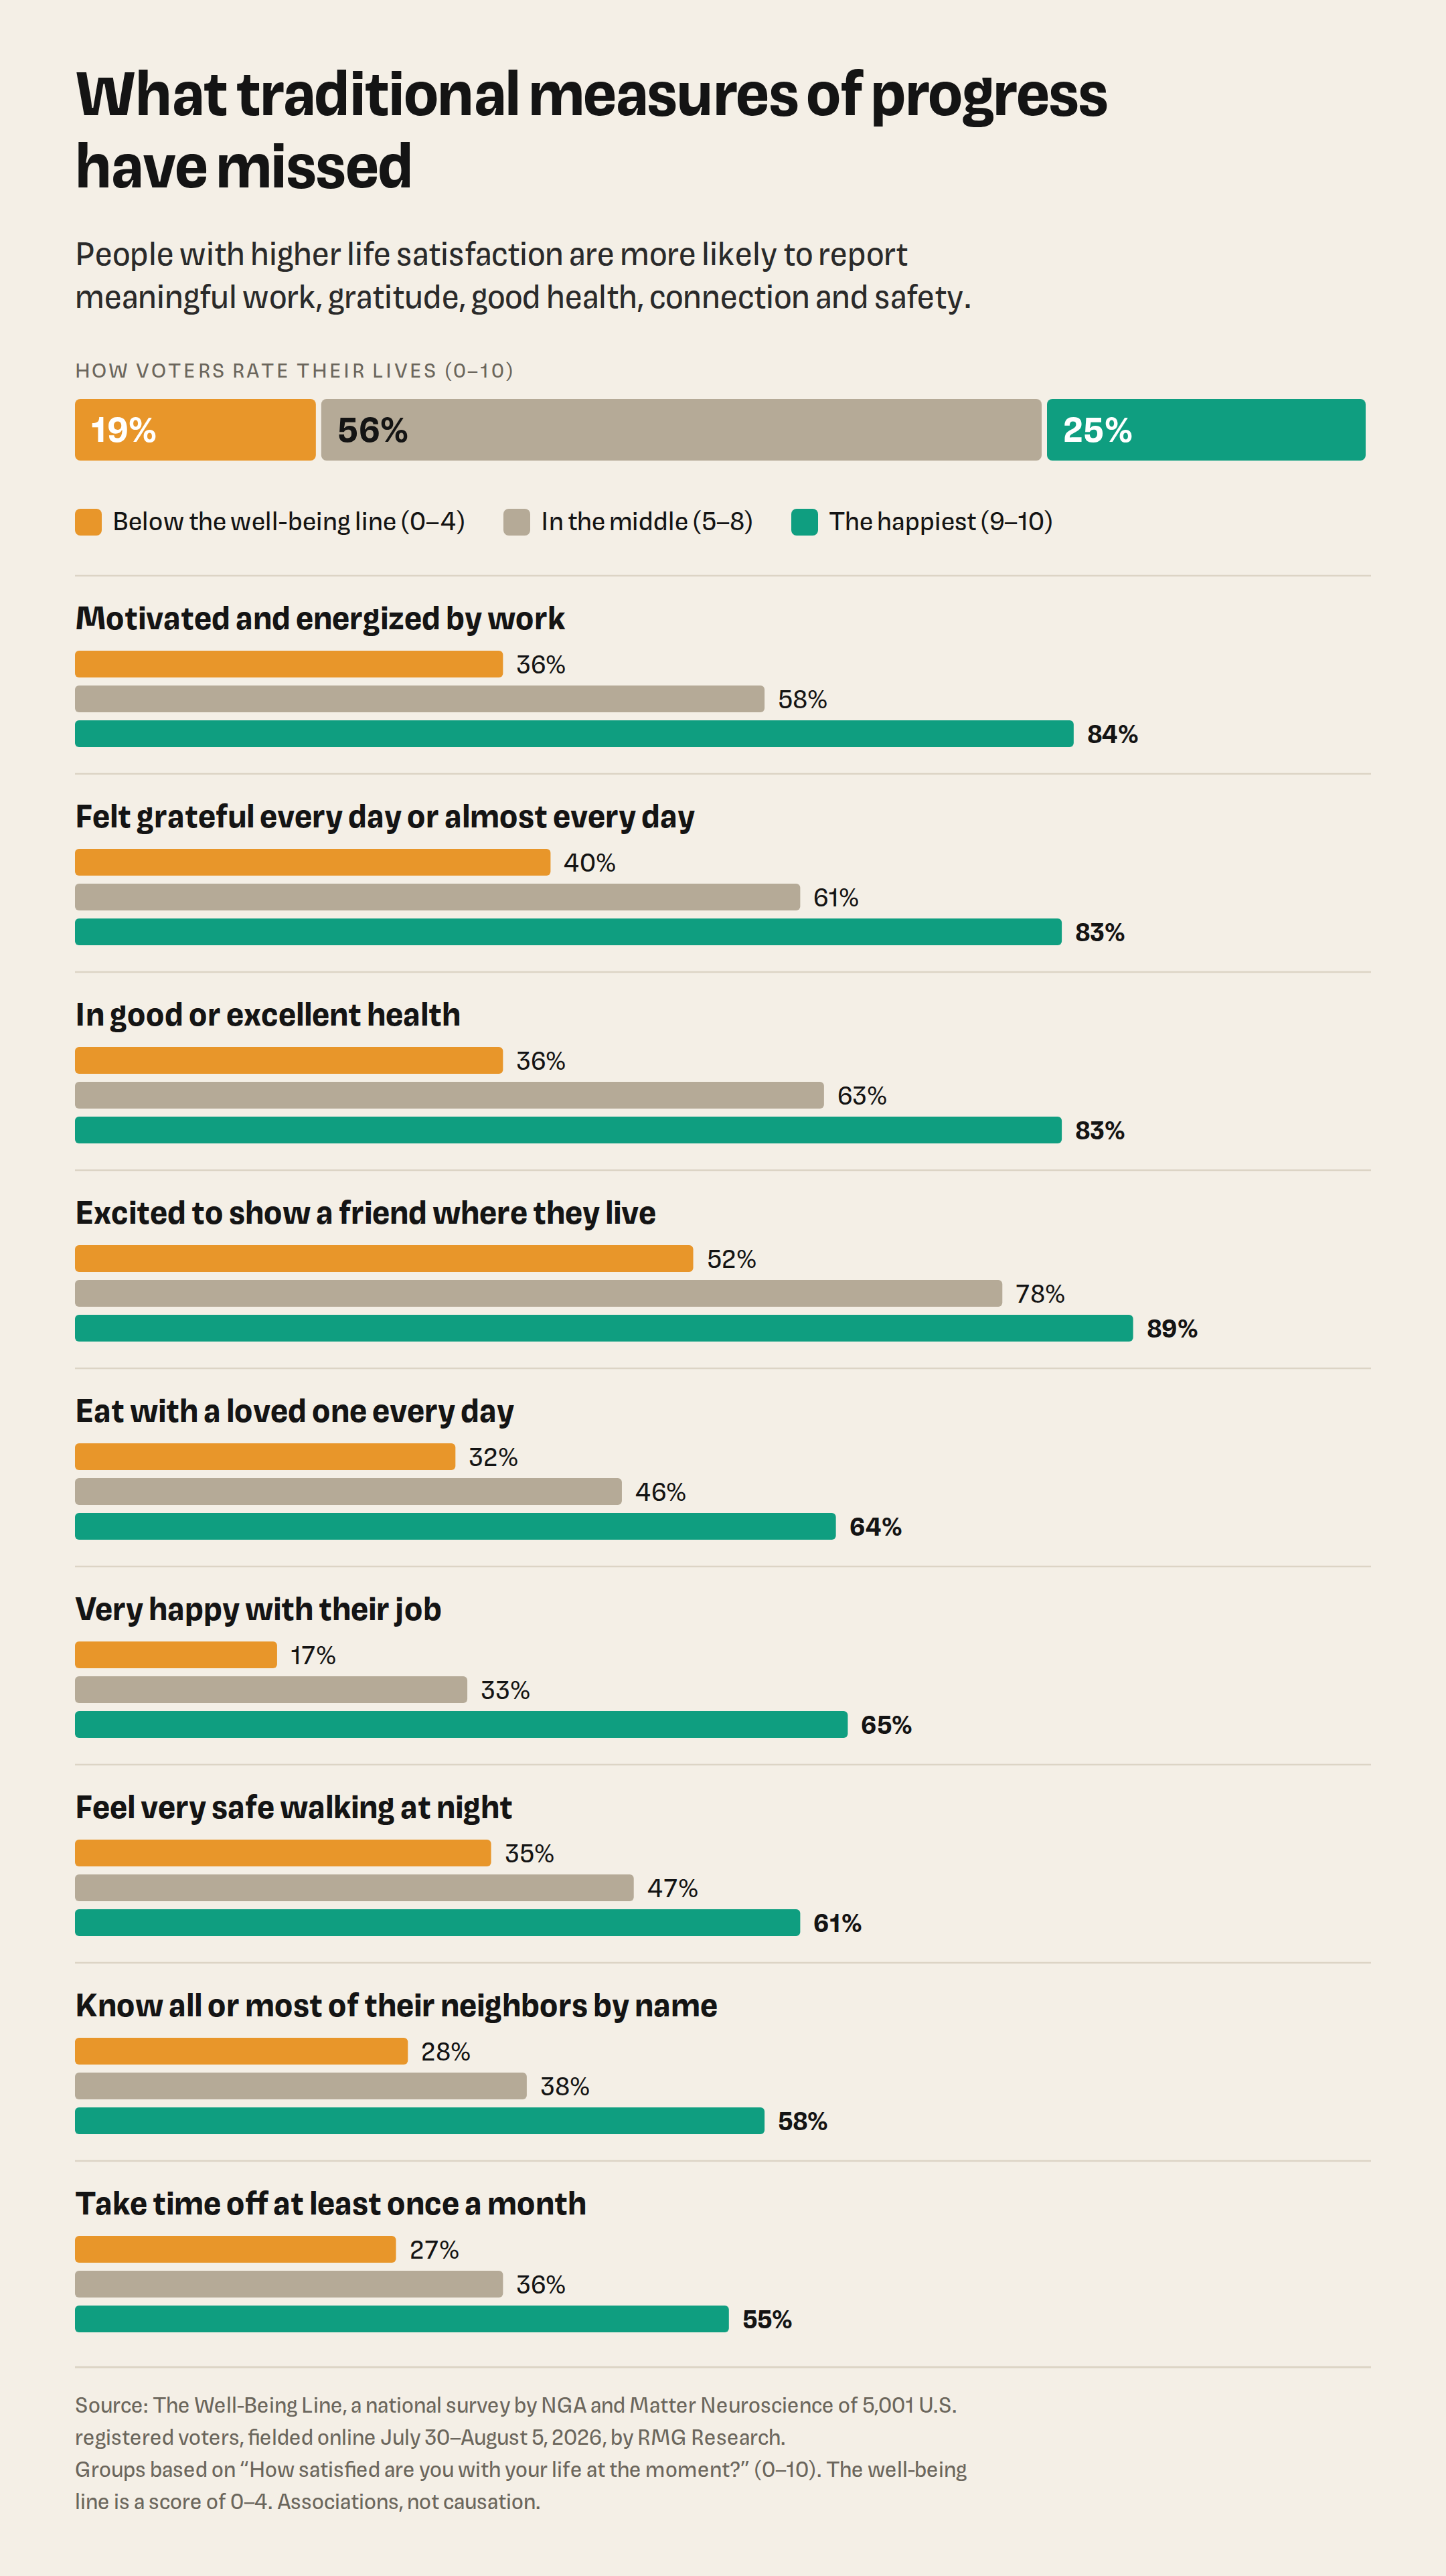
The survey cannot establish that these experiences cause greater life satisfaction. But their consistent relationship across the scale points toward the everyday conditions most closely associated with a satisfying life.
Most surveys focus on outcomes such as income, diagnoses, or use of public services. This survey was designed differently. It measures everyday experiences associated with positive emotion, then examines how those experiences relate to overall life satisfaction.
Research increasingly connects positive emotion to neurochemical systems involved in motivation, attachment, safety, social connection, and recovery from stress. Matter Neuroscience’s framework brings together six systems—dopamine, serotonin, oxytocin, endocannabinoids, opioids, and testosterone/estradiol—and nine families of positive emotion: enthusiasm, sexual desire, pride, pleasure, nurturant love, friendship love, amusement, contentment, and gratitude.
The survey worked backward from those emotions. Its questions capture ordinary experiences that research associates with one or more of these systems: sharing a meal, receiving a hug, feeling proud of one’s work, knowing a neighbor, experiencing gratitude, spending time outside, or feeling safe walking home.
One clarification is essential: the survey does not measure brain chemistry directly. Its questions were drawn from our previous research which associates each of these experiences with positive emotion and correlates them to their underlying neurotransmitters. Then it asks how those experiences relate to life satisfaction. The results show correlation, not causation.
The experiences associated with purpose, pride, and enthusiasm have some of the strongest relationships with life satisfaction in the study.
The survey cannot determine whether satisfying work improves life satisfaction or whether people who are satisfied with life view their work more favorably. It does show that meaningful work, real time off, and good health belong in any serious conversation about well-being.
Physical affection, shared meals, and family time show some of the widest gaps in the study.
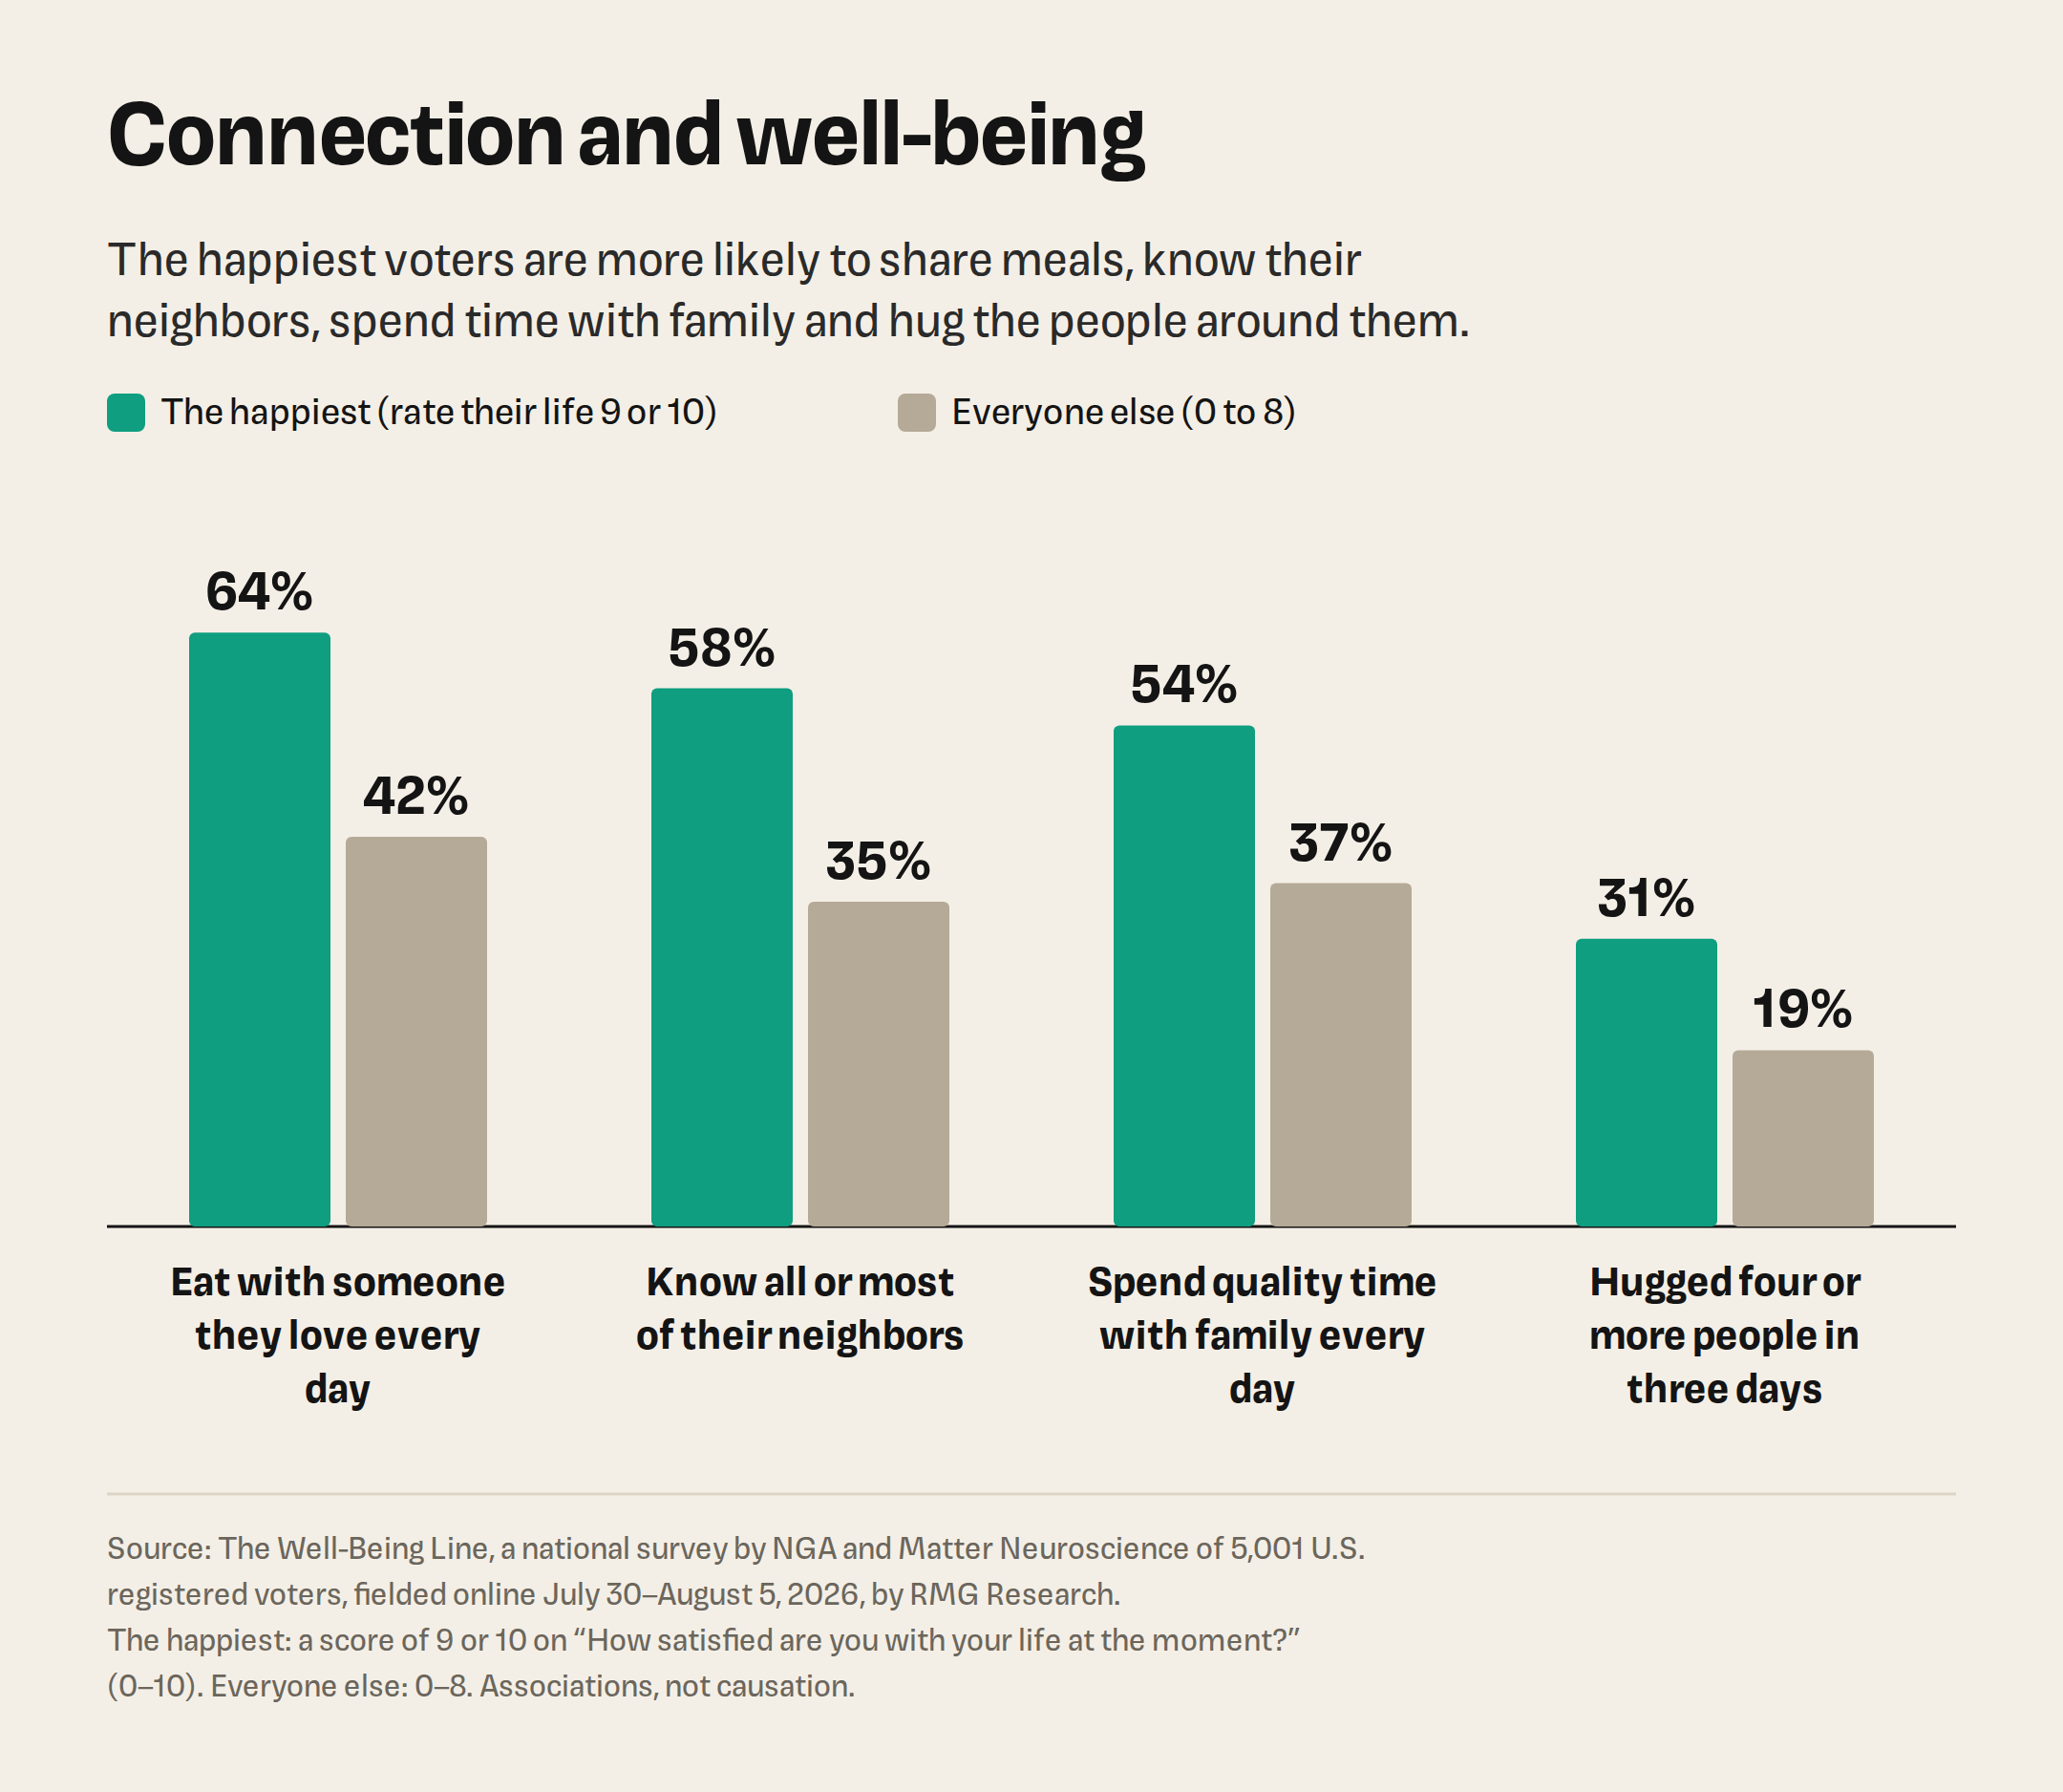
These measures do not prove that a hug or shared meal causes greater life satisfaction. Together, however, they point to a consistent pattern: people who experience more regular connection report substantially more satisfying lives.
The findings also highlight the importance of social support, gratitude, and pride of place.
Feeling safe may be less a single source of positive emotion than a condition that allows positive experiences to register.
Safety is not only about crime statistics. It also includes whether residents trust their surroundings, know the people around them, and believe support will be available when they need it.
The civic measures are less closely related to personal life satisfaction than work, health, or connection. They nevertheless reveal a widely shared desire for respect.
Read together, the findings reveal a consistent pattern: the everyday experiences associated with connection, purpose, safety, and belonging are more closely related to life satisfaction than many of the identities that dominate public debate.
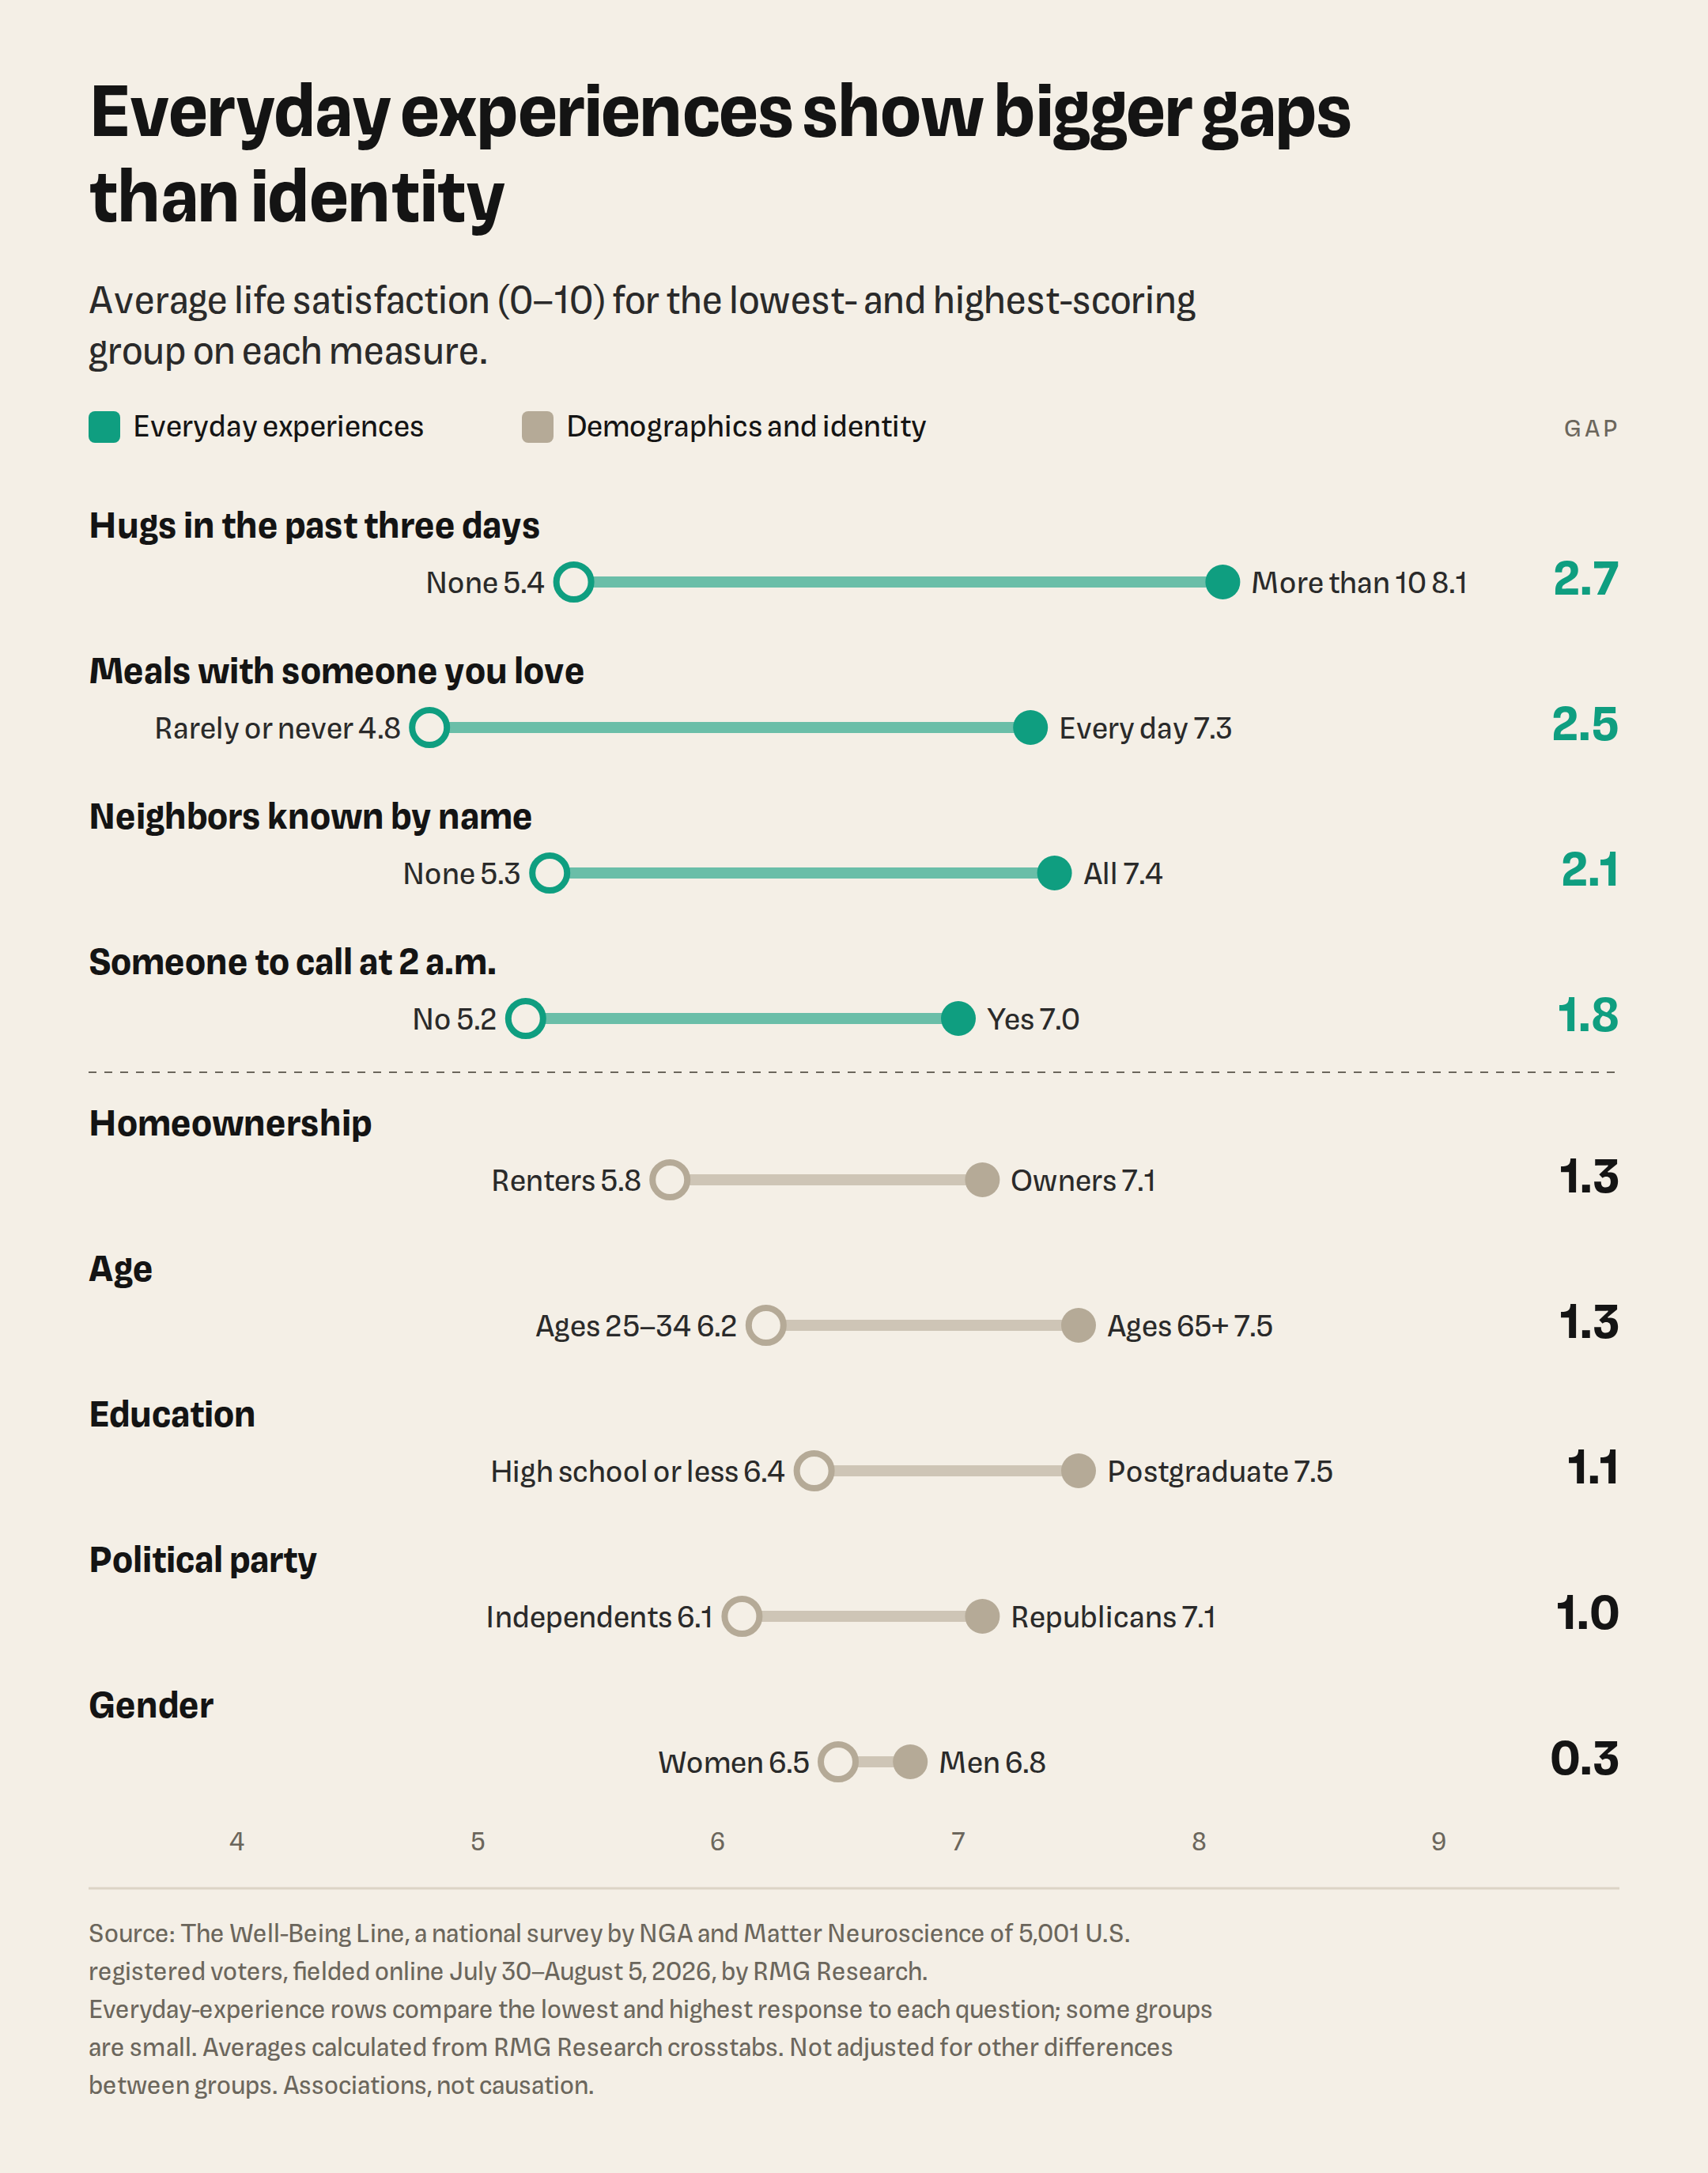
While the findings do not prove that connection causes greater life satisfaction, they do suggest that the relationships surrounding us are closely associated with how we experience our lives. These comparisons do not adjust for other differences between groups, such as age, income, or health, which may account for part of each gap.
State averages tell only part of the story. Life satisfaction varies more than twice as much across congressional districts as it does across states, revealing local differences that statewide data can hide. To see where well-being is strongest, and where it can grow, it must be measured locally. State and district figures are modeled estimates, and small differences between neighboring places should be read as illustrative.
For decades, leaders have measured progress through jobs, income, graduation rates, and economic growth. Those measures matter, but they do not reveal whether people feel supported, connected, safe, or satisfied with their lives.
Government cannot manufacture happiness. It can, however, influence whether people have the safety, time, opportunity, and social infrastructure needed to build satisfying lives. Safety holds a particular place on that list. By reducing fear and anxiety, it creates a foundation for people to experience positive emotions and engage more fully in life.
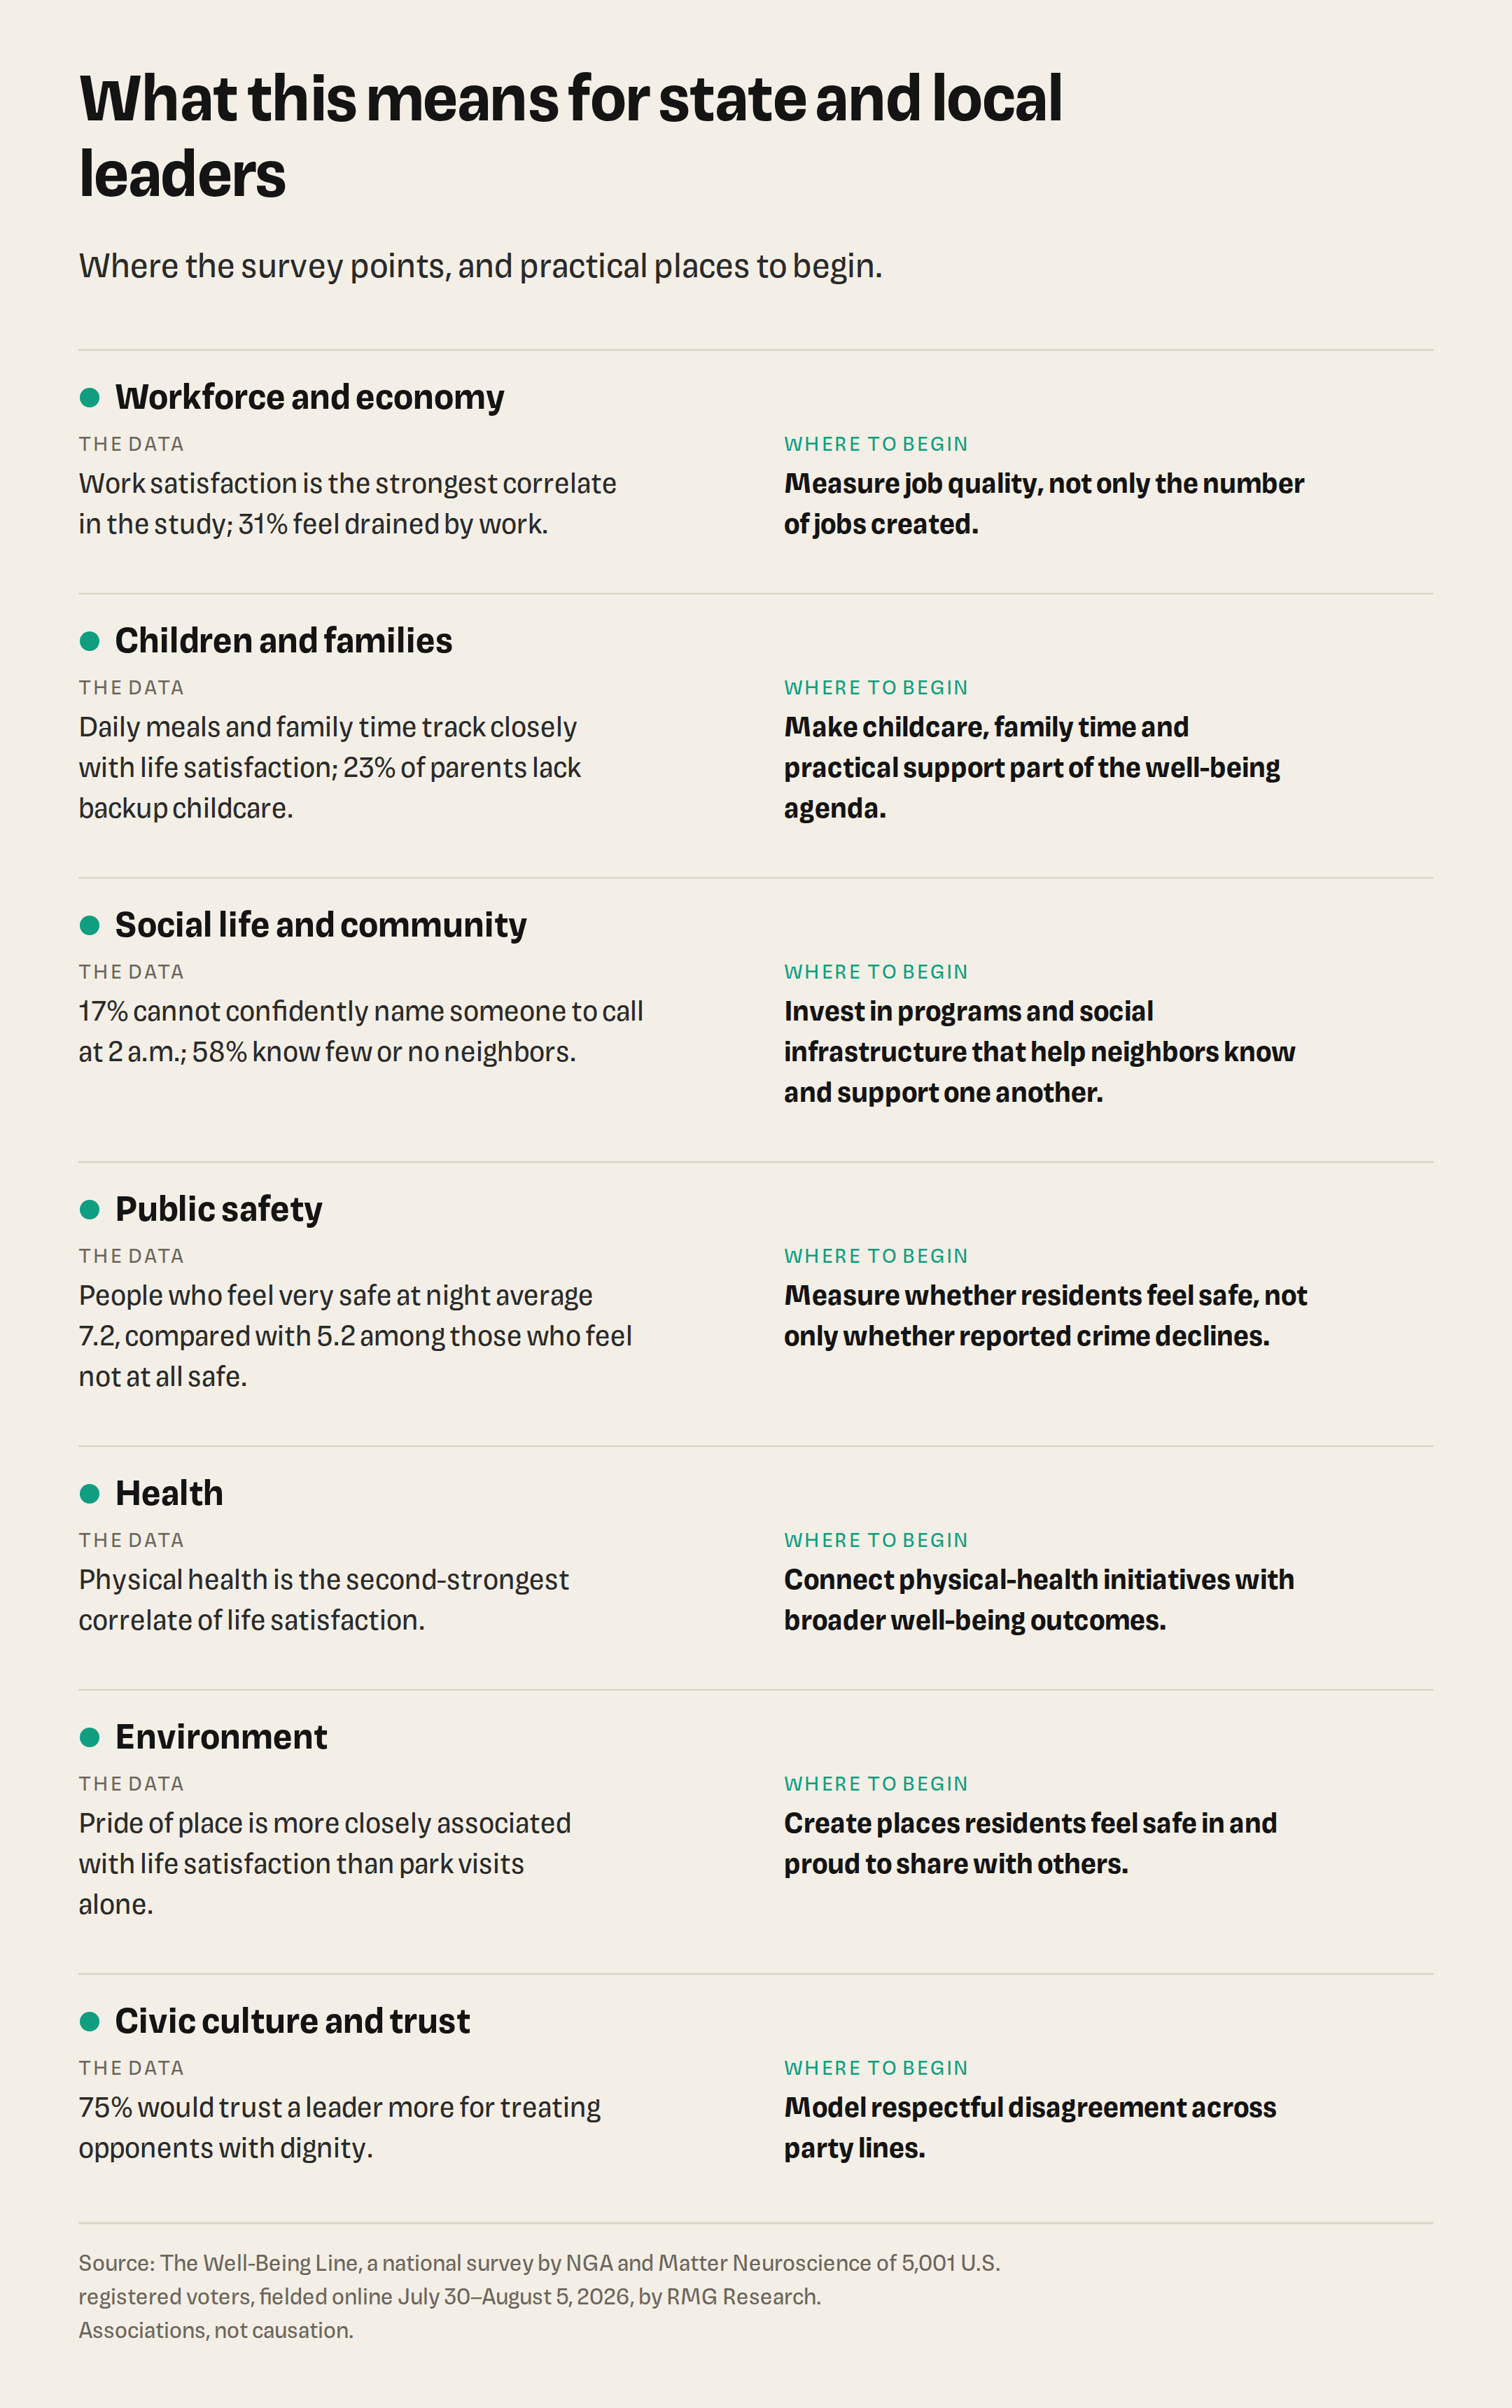
Above all, leaders should measure locally. A statewide average can appear healthy while individual communities are struggling. District-level measurement makes those differences visible. States can start with tools they already have: the CDC’s Behavioral Risk Factor Surveillance System, which every state runs, offers optional questions on life satisfaction, loneliness, and social and emotional support. In 2022, 39 states and the District of Columbia used them.
We often talk about America’s divisions in political or demographic terms. This study suggests another divide may matter more: the divide between people who feel supported, connected, safe, and purposeful and those who do not.
That divide can exist within the same state, the same city, or just an hour’s train ride away. The experiences separating the thriving from the struggling are also experiences that emerging research associates with the brain’s systems for positive emotion.
For most of our history, how people felt was one of the hardest things to measure. That is starting to change. Now we can be intentional about it: make people’s happiness an organizing principle of how we govern, work, and build communities, measured as carefully as jobs and growth, and invest in the everyday conditions that help people thrive.
* The well-being line is informed by the “suffering” threshold in Gallup’s Life Evaluation Index, which considers both current and anticipated life satisfaction. Because this survey asked only about current life satisfaction, the measures are related but not identical.
The Well-Being Line is a national report on well-being, with estimates for every state and congressional district. It measures the emotional and social conditions of life in America to help leaders make decisions based on how people are actually doing. It is based on a national survey by NGA and Matter Neuroscience, fielded by RMG Research.
Matter contact: Beth Stone, beth@matter.xyz